
Introduction
For the owner of a mall answering questions like “what price should this be mark” or “Should this be put on discount” are common questions that have to be answered. This is order to most amount of money possible while also spending the most efficient amount on resources possibly. The goal in this project is to group customers into clusters based on their demographics and spending behavior.

Key Question
The key question of this project is how we can use a KMeans model to group customers together based off their similarities and as an owner you would do this in order to find the best prices for targeted marketing.
Introducing The Data
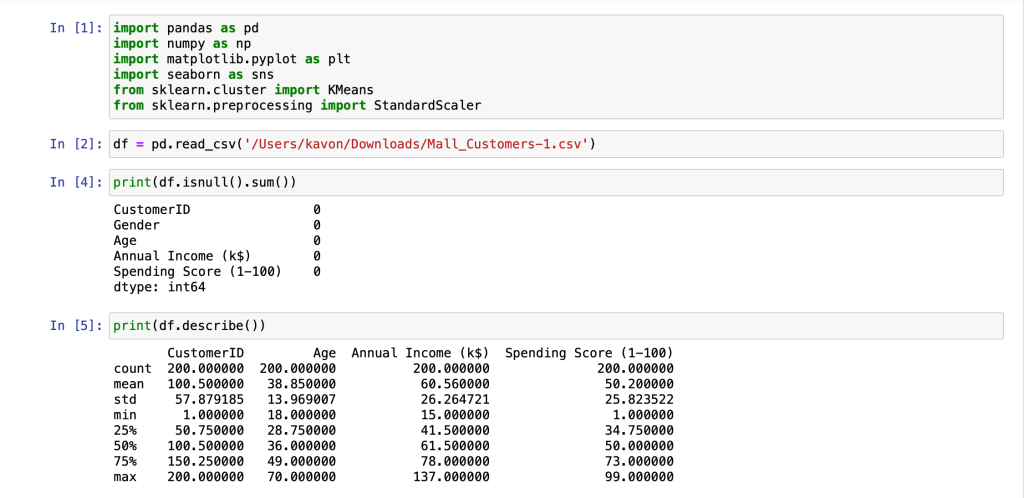
The dataset that was used is the “Mall_Customers” dataset that comes from Kaggle. It is a dataset that contains data about the customers from a mall and uses characteristics such as age, gender and annual income.
https://www.kaggle.com/datasets/vjchoudhary7/customer-segmentation-tutorial-in-python
Pre-Processing The Data
For the data pre-processing of this dataset there was a check for missing values and there was not any missing of the important characteristics that were used. The features that were selected to use in the model were “Age”, “Annual Income”, and “Spending Score”. The features were also scaled down in order to fit them into the clustering process.
Model Selection
The model that was selected to use is the K-Means clustering model and this was because of its simplicity and efficiency with the Mall_Customer dataset. It also has a clear interpretability of the dataset which is easy to read and can be understood. It also works well with numeric data which when using features like “annual income” and “age” can be important.
Model Training
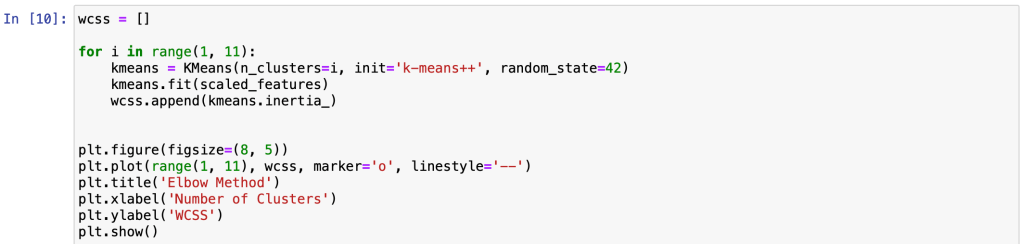
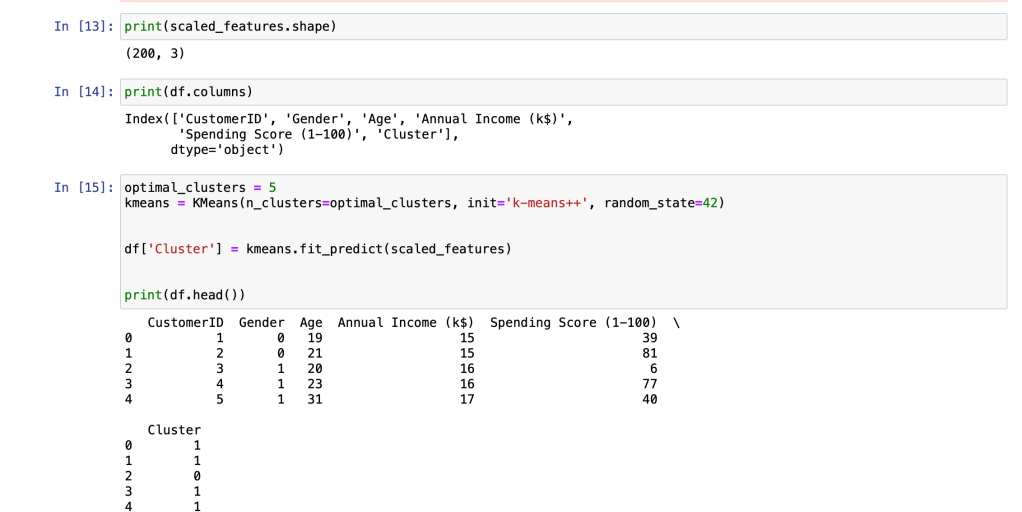
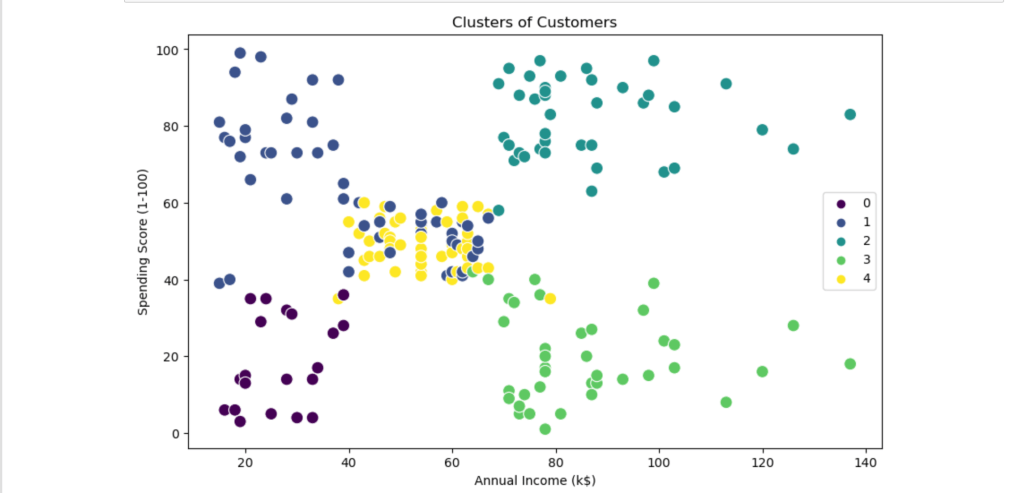
For the model training the features “annual income”, “age”, and “speeding score” were used. But in order to find the optimal number of clusters the elbow method was used and it pointed out the optimal number of clusters was 5. The model then put each customer in one of the 5 clusters based on similarities. Then a scatter plot was used to visualize the data.
Model Evaluation
WCSS ( Within-Cluster Sum of Squares ) was used in order to evaluate the total distance between the points in a cluster and their centroid and as said earlier it was found out that 5 clusters were optimal. The scatter plot was made as a visual aid in order it for it to be clear for the everyday person to read and understand.
Model Tuning
In order for the model to work better the features were scaled back in order to best fit in the model for clustering. The column gender had to also be converting into a numeric format in order to best work the K-Means clustering. A silhouette score was also used in order to enhance the quality of the clusters.
file:///Users/kavon/Downloads/Clustering%20Project%20.html

Final Thoughts
In this projected K-means clustering was applied to a mall dataset in order to find out similarities with different groups so in order to help with target marketing for businesses. The K-means model was efficient in dealing the data and gives clear results in the final visualization. As said earlier this project could be used to help targeting marketing for not only malls but multiple different businesses as well.


Leave a comment